In Part 3 of this tutorial, we began adding unit tests to our project. So now we know that at least some of our project has been tested. But how much? In order to answer that question, we’re going to add some code coverage measurement to the project. The source code for this tutorial may be found on GitHub. This part’s code is in the Version3 directory.
Update: Since the introduction of iOS 7, there’s an additional step required to make everything work, which is described in this post.
For this, I’m indebted to the Jon Reid at qualitycoding.org, who has done most of the hard work. You can see the original post describing the tools I’m going to use at http://qualitycoding.org/xcode-code-coverage/.
Apple put support for code coverage into early versions of Xcode 4. There was a bit of a bumpy ride for a while, however, as a variety of tricks were required, which changed from Xcode version to version. Fortunately, since the advent of Xcode 4.5 (which is what I’m using for this tutorial sequence), this has all been pretty much smoothed out. The basic sequence is that:
- You set up your project to be instrumented, and to generate test coverage files.
- You run your unit tests, which cause the coverage files to be generated.
- You post-process the coverage files into a form that’s easy to use.
To handle the first part, we need to change two of the default settings in our project:
First, we enable “Generate Test Coverage Files” on the Debug version of our project.

Second, we enable “Instrument Program Flow”, again for the Debug version of our project.

With that, Xcode will now generate the raw information we need.
There is a quirk, however. The coverage files get generated into a directory that is specific to your particular project and computer. As an example, when I was working on this portion of the tutorial, the files are under a directory named ~/Library/Developer/Xcode/DerivedData/iOS_Unit_Testing-awiaebynwuyezddtpavbhofjrcgi/. Not something you want to try to type or hard code. This is the first thing that the qualitycoding.org scripts help with. Their scripts, located on GitHub, take care of this. One of their scripts exports this directory path as part of your build. Thus, after installing a copy of their scripts as part of the project:
- Go to the build settings for your target. (Note, this time we’re using the target, not the project.
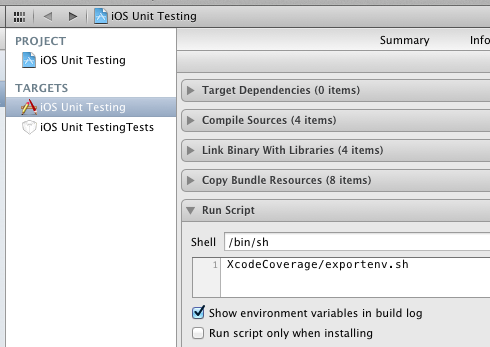
- Press “Add Build Phase” at the lower right, and select “Add Run Script”
- The script to be added is
XcodeCoverage/exportenv.sh, assuming you have installed the scripts in aXcodeCoveragefolder that is a sibling of your target and test folders.
The result looks like this:
What this script does is to create another script named env.sh in the XcodeCoverage folder. env.sh will look something like this:
export BUILT_PRODUCTS_DIR="~/Library/Developer/Xcode/DerivedData/iOS_Unit_Testing-awiaebynwuyezddtpavbhofjrcgi/Build/Products/Debug-iphonesimulator"
export CURRENT_ARCH="i386"
export OBJECT_FILE_DIR_normal="~/Library/Developer/Xcode/DerivedData/iOS_Unit_Testing-awiaebynwuyezddtpavbhofjrcgi/Build/Intermediates/iOS Unit Testing.build/Debug-iphonesimulator/iOS Unit Testing.build/Objects-normal"
export OBJROOT="~/Library/Developer/Xcode/DerivedData/iOS_Unit_Testing-awiaebynwuyezddtpavbhofjrcgi/Build/Intermediates"
export SRCROOT="/work/code/sbt/blog/iOSUnitTesting/Version3"
Because this file is specific to your computer, and is regenerated each time the project runs, you’ll typically want to exclude it from your version control system.
Next, we’d like to get the code coverage information into a form that’s easy to understand. Fortunately, the lcov project on SourceForge does a very nice job of this, and Jon’s scripts are designed to take advantage of this. Thus, we download a copy of lcov-1.10, and install that into the XcodeCoverage folder.
Finally, for all this to work you need to have the Command Line tools installed in order to have access to a program named gcov. You can download these tools through Xcode by going to the Xcode Preferences, clicking on Downloads in the top bar, and then on Components. If, during any of the following, you get complaints about not being able to find “gcov,” you’ve probably missed this step.
With all this done, the steps are as follows:
- Run your unit tests. As part of this:
- Xcode will build your project. This will invoke the
exportenv.shscript, which will generate anenv.shfile in theXcodeCoveragefolder that knows where the output files will be generated. - Xcode will run your unit tests. Because the unit tests are run in Debug mode, code coverage files will automatically be generated.
- Xcode will build your project. This will invoke the
- From within the
XcodeCoveragefolder, run thegetcovscript. This will:- Use the exported
env.shfile to locate the coverage files. - Use
gcovandlcov-1.10to collect these into HTML form - Invoke your Safari browser to display the results.
- Use the exported
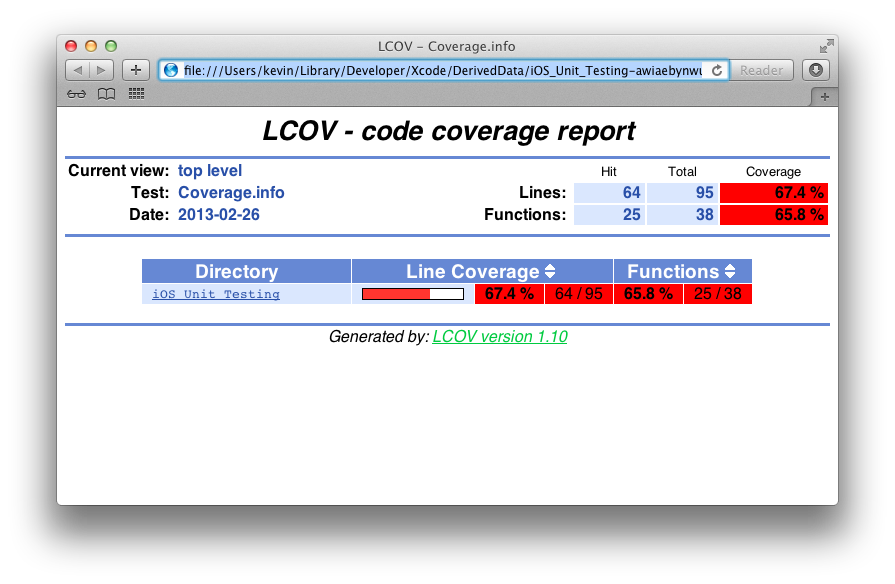
In our case, we get something that looks like this:

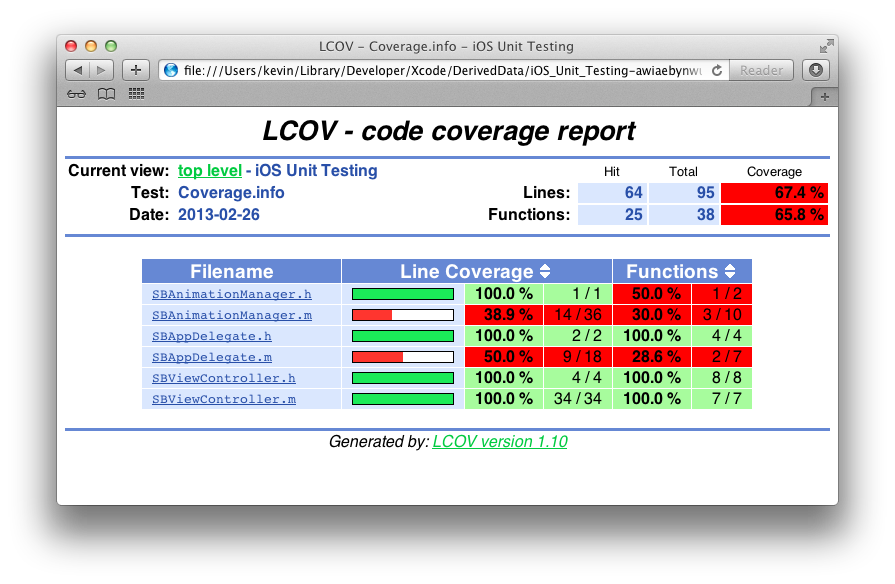
If we click on the iOS Unit Testing link, this expands into the source files in that directory:

With this, we can see that our unit tests have actually exercised all the lines in the SBViewController.h and SBViewController.m files. SBAppDelegate.m and SBAnimationManager.m haven’t been exercised much, but we haven’t written any tests for them, so we shouldn’t be surprised at that.
So now we have a way to evaluate whether our unit tests are doing a good job or a poor job at exercising all our code. In the next part of this tutorial, we will return to adding unit tests.

